Employee Task Management System
Fullstack Development Projects
Step-by-Step Approach for the Employee Task Management System:
1. Initial Planning and Conceptualization
Goal Identification: The project began with the goal of creating an Employee Task Management System, aiming to manage task assignments, track progress, and generate reports. Early planning involved identifying key features like task creation, user management, task tracking, and reporting.
Technologies Decided: The tech stack was chosen, including Python and Flask for backend development, HTML, CSS, and SQL for the frontend and database management. JavaScript was initially considered, but Bootstrap was later chosen for styling and responsiveness.
Diagrams for Planning:
Class Diagram: A class diagram was used to outline the structure of the system, including the relationships between key components like users, tasks, and roles. This helped in designing the database schema and understanding how entities would interact.
State Machine Diagram: A state machine diagram was used to visualize the workflow and different states of a task (e.g., pending, completed, in-progress). This ensured that the logic for task transitions was correctly implemented in the backend.
2. Database Design and SQL Integration
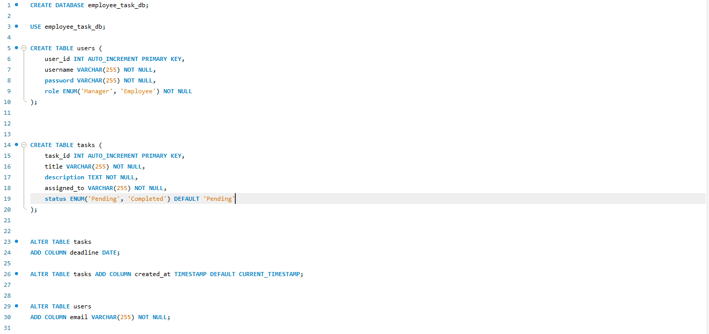
Database Setup: The class diagram guided the creation of the database schema, which included tables for users, tasks, and user roles. The relationships between tasks and employees were clearly defined, ensuring that task assignments and statuses could be easily tracked.
SQL Queries: SQL queries were written to handle key operations such as adding, editing, and deleting tasks and users. Queries were also created to generate different types of reports based on task status or employee performance.
3. Backend Development with Flask
Flask Setup: The core backend logic was developed using Flask. Routes were set up for managing user authentication, task creation, task viewing, and editing, all driven by the relationships defined in the class diagram.
Session Management: Flask's session management was used to control user access and ensure only authenticated users could access specific pages. The session data also tracked user roles (e.g., manager or employee).
User Roles: The system differentiated between managers and employees, with managers being able to create, assign, and view tasks, while employees could only view and update the status of their own tasks.
4. Frontend Development with HTML, CSS, and Bootstrap
Initial HTML and CSS: Basic HTML templates were created for different pages like the login, task creation, and user management pages. These were styled using custom CSS for structure and layout.
Bootstrap Integration: Bootstrap was added to improve the design and responsiveness of the application. Buttons, forms, and navigation were styled to provide a more polished and professional appearance.
5. Error Handling and Validation
Form Validation: Input validation was applied to ensure that forms were submitted with correct and complete data (e.g., ensuring deadlines weren’t set in the past).
Error Messages: Flash messages were integrated to notify users of errors or successes when interacting with the system, ensuring clear feedback was provided.
6. Email Notifications
Task Assignment Notifications: Using Python’s smtplib library, email notifications were sent to employees when tasks were assigned to them. This feature was tested thoroughly to ensure employees received timely notifications.
SMTP Configuration: The email system was integrated with Gmail's SMTP server, with proper security measures (such as app-specific passwords) in place.
7. Report Generation
PDF Report Generation: Managers could generate reports based on task status or by employee, and export these reports to PDF using the FPDF library.
SQL Queries for Reports: Custom SQL queries fetched the relevant data for each report type, ensuring that accurate and up-to-date information was presented.
8. Task Reminder Automation
Automated Reminders: A scheduling system was developed using the schedule library to automate task reminder emails, sending notifications to employees about approaching task deadlines daily at 9 a.m.
Testing the Automation: The reminder system was initially tested with a shorter interval (every 30 seconds) to ensure it functioned correctly before switching to daily scheduling.
9. Final Touches: UI and UX Improvements
UI Refinements with Bootstrap: Bootstrap was used to enhance the visual appearance and usability of the application. Navigation, buttons, and forms were all restyled to be more user-friendly.
Responsive Design: Ensuring the application was fully responsive, the layout was tested on various screen sizes to guarantee usability across different devices.
10. Testing and Debugging
Comprehensive Testing: The system was tested for edge cases, including form validation, session management, and user permissions. Task creation, editing, and viewing were thoroughly tested.
Error Handling: Error messages were refined to provide clear and actionable feedback to users. This improved the overall user experience and ensured the system handled unexpected inputs gracefully.
11. Final Documentation and Deployment
Documentation and Diagrams: Documentation, including comments in the code, and the initial class and state machine diagrams, were reviewed and finalized to ensure they aligned with the project’s implementation.
Requirements and Git Integration: The requirements.txt file was created to specify dependencies, and the project was version-controlled and backed up using Git, ensuring that it could be easily deployed and further developed.
Cross-Referencing with Diagrams: The class diagram and state machine diagram were cross-referenced with the final implementation to verify the design matched the code structure and logic.

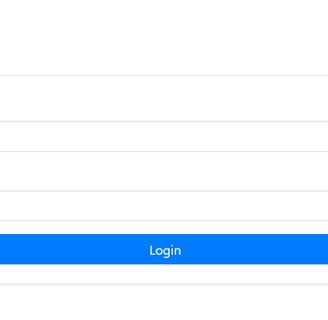

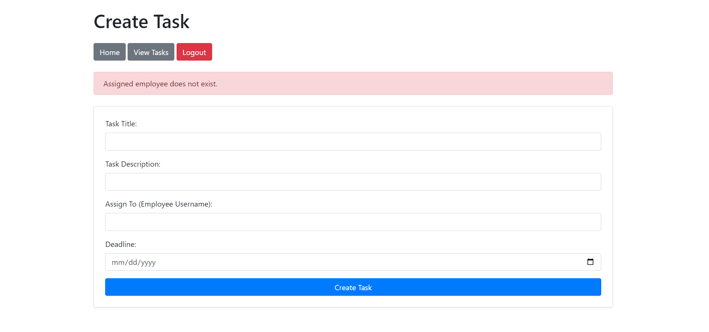

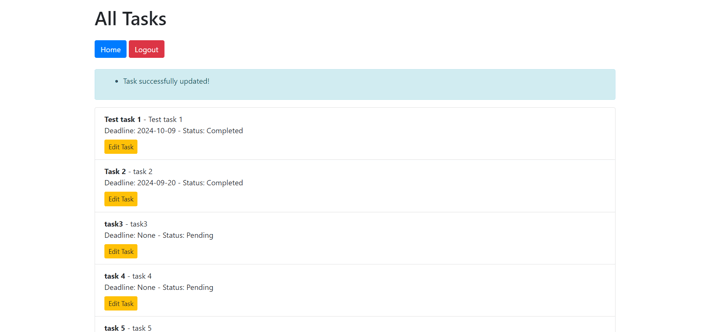

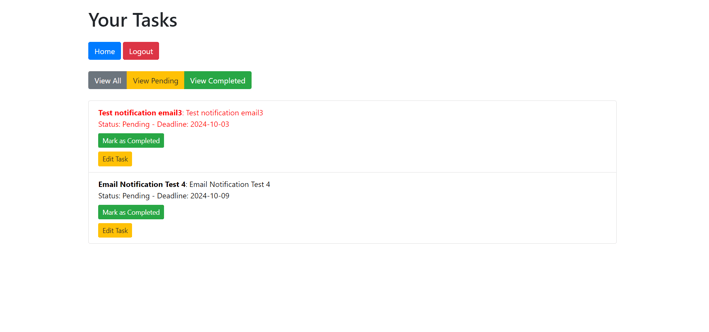

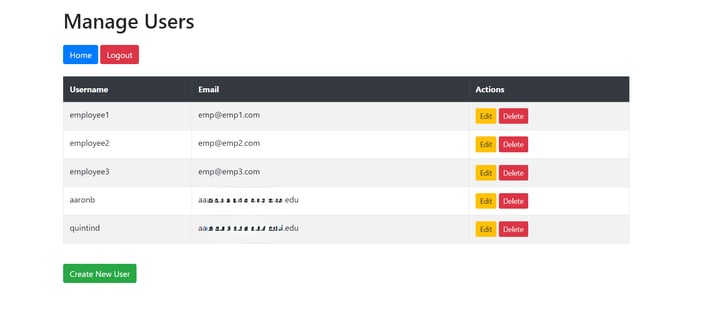

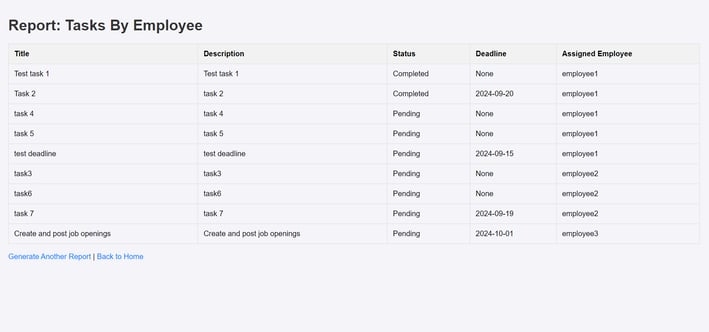

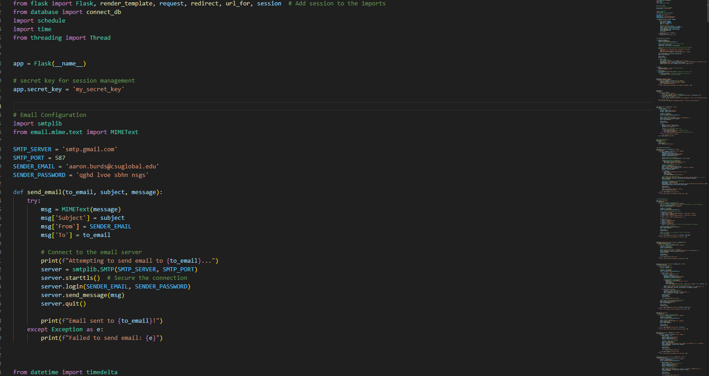


Check out the project files!
Screenshots of the system!:
Data Analytics Projects
Showcasing my journey in IT and data analytics through projects.


Project World Life Expectancy Data Cleaning
The Problem: Several critical issues were identified in the original dataset that could compromise the accuracy and integrity of the analysis. These issues must be addressed to ensure reliable research outcomes.
Identified duplicate records for the same country and year, raising concerns about double-counting.
Missing status information (developed vs. developing) could skew comparative analyses between country categories.
Life expectancy values were missing, posing a challenge for deriving meaningful insights.
Some records had empty or uninformative data in key columns, risking incomplete or biased analyses.
Addressing these issues is essential for ensuring the integrity and reliability of the research outcomes.
The Solution: A series of SQL queries and data cleaning steps were implemented to resolve the critical issues in the original dataset, ensuring accurate and reliable analysis.
Identifying Duplicate Records:
Used the query SELECT country, Year, CONCAT(Country, Year), COUNT(CONCAT(Country, YEAR)) to locate and count duplicate combinations of Country and Year.
Removing Duplicates:
Applied DELETE FROM world_life_expectancy with the ROW_NUMBER() function to partition the dataset by Country and Year, retaining only the first occurrence and removing duplicate entries.
Handling Missing Status:
Queried for missing status fields using SELECT * FROM world_life_expectancy WHERE STATUS = ''.
Updated missing statuses for "Developing" countries using the UPDATE world_life_expectancy query.
Filled in missing statuses by matching countries with consistent statuses in other rows based on existing data.
Filling in Missing Life Expectancy Data:
Identified missing life expectancy values with SELECT Country, Year, Life expectancy WHERE Life expectancy = ''.
Imputed missing values using SQL logic: calculated the average life expectancy from surrounding years with ROUND((t2.Life expectancy + t3.Life expectancy) / 2,1) to ensure data completeness.


Check out the data!
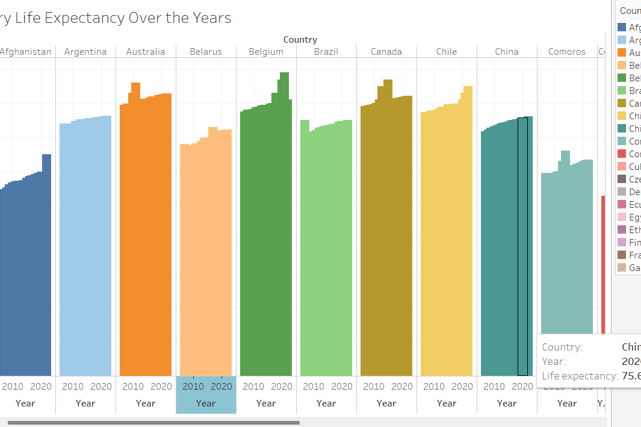
The SQL queries applied to the cleaned World Life Expectancy dataset provided insights into life expectancy trends, GDP relations, and country status comparisons. These queries helped reveal key patterns and outliers, allowing for a deeper understanding of the data.
Key Insights and Queries:
Life Expectancy Changes Over Time:
Query: SELECT Country, MIN(Life expectancy), MAX(Life expectancy), ROUND(MAX(Life expectancy) - MIN(Life expectancy),1)
Insight: Identified changes in life expectancy for each country over time, highlighting the life expectancy increase over a 15-year period.
Average Life Expectancy by Year:
Query: SELECT Year, ROUND(AVG(Life expectancy),2)
Insight: This query calculated the yearly average life expectancy globally, showing overall trends in life expectancy improvements over time.
Life Expectancy and GDP Comparison:
Query: SELECT Country, ROUND (AVG(Life expectancy),1) AS Life_exp, ROUND(AVG(GDP),1) AS GDP
Insight: Countries with higher average GDPs tend to have higher life expectancies, supporting the relationship between economic development and health outcomes.
High vs. Low GDP and Life Expectancy:
Query: SELECT SUM(CASE WHEN GDP >= 1500 THEN 1 ELSE 0 END) High_GDP_Count, AVG(CASE WHEN GDP >= 1500 THEN Life expectancy ELSE NULL END)
Insight: The query segmented countries into high and low GDP groups and calculated their corresponding average life expectancies. It illustrated the significant difference in life expectancy between wealthier and less wealthy countries.
Life Expectancy by Country Status (Developed vs. Developing):
Query: SELECT Status, ROUND(AVG(Life expectancy),1)
Insight: This query confirmed that developed countries generally have higher life expectancies compared to developing countries.
BMI and Life Expectancy Relationship:
Query: SELECT Country, ROUND (AVG(Life expectancy),1) AS Life_exp, ROUND(AVG(BMI),1) AS BMI
Insight: Showed the relationship between a country’s average BMI and its life expectancy, suggesting potential health correlations.
Rolling Adult Mortality for United Countries:
Query: SELECT Country, Year, Life expectancy, SUM(Adult Mortality) OVER(PARTITION BY Country ORDER BY Year)
Insight: Tracked the cumulative adult mortality for countries with "United" in their name, providing insights into long-term mortality trends in these nations.


Check out the data!
Project World Life Expectancy Data Analysis

Journey
Showcasing IT and data analytics projects and insights.
Connect
Explore
© 2024. All rights reserved.
